Sunshine was happy to see me when I got home.
Here I try to put ideas together in ways that perhaps are not immediately apparent. After all everything and every cause and effect is ultimately related to every other. Finding these hyper-dimensional ties between things and pointing them out is my pleasure, and indulgence here.
Saturday, April 30, 2005
Chicago 3D Image pair April 2005
The 3D anaglyph version of April 2005 Chicago ws not very easy to see with Red-Blue glasses so I've put together a couple of stereo pair images. One showing most of the center of the city and another zoomed in to just the center of the city.
To view these two stereo pair images you can cross you eyes slightly and try to get the Sears tower images to merge together. Then you will see Chicago in 3D as seen from a northward approach to Midway airport. (Note: Many people can't cross their eyes very well and you should not do it if it hurts. It is eaiser to merge the images if they are further away from you.)
Thursday, April 28, 2005
Chicago
Chicago 3D
Something else I've never seen, a 3D anaglyph of Chicago. I took the images to build this during landing so the red image is actually taken several hundred feet lower than the green/blue.
The 3D of Mt. Rainer below is much eaiser to look at and the paralaxed images matched up better because the altitude of the aircraft was relatively constant. I believe that Mt. Rainer is also further away in it's image than Chicago. The horizontal image difference is about the same. (which is to say the apperant preceived realative size of Chicago to Mt. Rainer is approximately correct.)
Wednesday, April 27, 2005
Agile
I've been thinking about agile recently and have found a few good books and links. In particular Alistair Cockburns site is very useful. He includes most of his original papers as links.
It's interesting that DeMarko is very much on board with the Agile development processes. It's really an extension of work he began decades ago.
Saturday, April 23, 2005
3D Mt. Rainer
Friday, April 15, 2005
National Cynicism day
It is tax day, and gas prices are insane, government waste is at outrageous new highs, and airport security is off the hook absurd.
I swear the whole American dream has gone to hell.
So I officially declare April 15, National Cynicism Day!
Have a nice day! (tm)
I swear the whole American dream has gone to hell.
So I officially declare April 15, National Cynicism Day!
Have a nice day! (tm)
Saturday, April 09, 2005
PA-160, Flying 50W!
I flew PA28-160 Nxx50W today. A nice surprise was that it is a PA-160, not a 140 so more power and payload. Filled her up to tabs put Marsha in the back seat flight instructor in the right seat. Left PAE to Useless Bay for some maneuvers. It was an aircraft checkout ride, 3 landings 1 full stop. Approach and takeoff stall practice, steep turns, radio practice, and pattern work.
It was fun. The most fun I've had in over 11 years, the last time I flew an airplane. I need to get my medical renewed and pilot license address corrected.
Things I did well;
Things that need work;
I'll get my paperwork organized and then do my bienial flight review (BFR). Then I'll have my wings again.
PS. I didn't get any pictures, I was otherwise occupied :)
It was fun. The most fun I've had in over 11 years, the last time I flew an airplane. I need to get my medical renewed and pilot license address corrected.
Things I did well;
- Power on and takeoff
- Heading rollouts
- Stall recovery
- Steep turns
Things that need work;
- Instrument fixation
- Airspeed maintenance on final
- Takeoff heading drift
- Cockpit paperwork managment
I'll get my paperwork organized and then do my bienial flight review (BFR). Then I'll have my wings again.
PS. I didn't get any pictures, I was otherwise occupied :)
Wednesday, April 06, 2005
Simple Music Theory
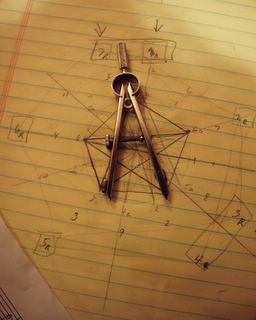
I thought you might be interested in a little history. This is the original worksheet where I designed my first pentographic music relationship. This very simple diagram embodies all of the relationships of music theory.
This isn't the first diagram I ever made but it is close. I experimented with this and my guitar and had a lot of fun composing melodies. This was around February of 2003 so I guess I developed this music diagram method in summer and fall of 2004 though I had tried to find a way to represent music theory relationships since the 1970's. It just took a while.
A side note the compass here I inherited from my dad. It's a nice instrument that he used in his math and science courses at Clemson University in the 1950's and 60's.
This is a different original music theory diagram. This may be the third digram created around the middle of 2002.
Simple Music Theory
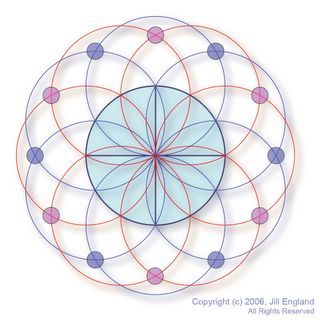
I've never posted this version. It shows an 12 note octave, a 7 note scale and their relationship.
I did not yet point out the relationship between the first and second circles. You could draw them as two sine waves of the same frequency one half sine wave out of phase. So the intersections of the vertical circles (blue) intersect between the horizontal circles (red). I think I've colored the little outside row of dots inversed i.e. the blue should be red and red blue.
Further talking I think might spoil the symetry of the drawing and I'm getting anxious to create a few real scales using this. It may take me a few days to do this since I'm kind of busy this weekend. I am thinking about it and will post a diagram with real note labels soon. Before then you can create a C scale very eaisly (CDEFG) by writing a C next to 1, B next to 2, etc.
To create a scale in A put an unwriten form over the C scale and rotate the page until the root scale note 1 on the top form is over the A on the C scale. Copy the notes through the paper and that would be your A scale. Why? To preserve the note phase relationships to each other.
I'll do this example and post both C and A scale diagrams next.
Tao
Funny, I catch myself running hard, in order to catch up, to where I already am. In a way it's like going backwards.
What I need is just a moment to sit still, rest, and let the world unfold according to it's nature. To hurry it all is like trying to speed hach a chicken in an incubator when your egg is from a robin.
It just won't do and will give me a headache as well.
What I need is just a moment to sit still, rest, and let the world unfold according to it's nature. To hurry it all is like trying to speed hach a chicken in an incubator when your egg is from a robin.
It just won't do and will give me a headache as well.
Monday, April 04, 2005
Simple Music Theory
Simple Music Theory 101
This is a blank pentagramic (word) music theory worksheet. The intersection of the circles with the edge of the center circle represent the 12 total notes of an octave. Select seven of them, in the pattern of 1x2x34x5x6x7 to select the notes of a scale.
I'll let you work out a couple of scales for yourself it's more fun that way :) You could try a C scale labeling the notes CxDxEFxGxAxB (replace the x's with the either sharp or flat notes of your choice.) A major chord is notes 1,3,5 of a scale. So you can compute the notes of any major or minor chord. When creating chords notice the notes direcly accross the circle from each other and notice how they change the chord sightly, try 1,4,6 or 7,3,5.
I'll practice some of these this week and come give some of my impressions. An interesting melody is found when playing the notes opposite each other i.e. 52631. It's not a conincidence that a pentegraphic scale coincides with drawing a pentegram over the circle.
PA-140, Flying Nxx50W!
This is the cockpit of N...50W. She is a Piper 140 built in 1966. She has the old fashioned Hershey-Bar wings, ceiling trim handle that looks like an old car window roller, push pull throttle and mixture, and toe brakes on the pilot side only.
She is a lot like my old 1969 PA-180 but with a little more wear around the edges and a bit less power. She needs someone to fly her and worry about little bits so I'm going to get checked out to fly her this weekend. I'll post some shots of the checkout ride when it's done. Still have to refresh my medical and change the address on my pilot license.
Saturday, April 02, 2005
Power Consumption and Production in US
I thought it would be interesting to compare statistics of electric power consumption and consumption trends. I believe that prosperity can be directly tied to how much power a society uses and to what applications they apply that power.
I found a spread sheet that details power costs and consumption between residential, industrial, and commercial customers. I’ve discovered some stunning relations and trends in electric power consumption.
1. DC; The District of Columbia, has the lowest industrial to residential power use of ANY state. The amount of non-productive power use in DC is stunning. The average ratio for all states in 2004 is 0.83, DC has an astonishingly low ratio of 0.03. Nothing of commercial value is produced in DC at all.
2. Kentucky has THE LOWEST power prices of ANY state. 4.60 cents per kwh. That’s lower than number 2 Wyoming at 4.96. Washington State comes in 5th on the list of cheap power states at 5.56. Kentucky gets it’s inexpensive power because they 1) Fight for it and keep thieves and scoundrels from looting their power system – court fights to keep the power inexpensive. 2) They have billions of tons of coal and they use it freely to produce power.
3. Wyoming has THE highest ratio of industrial to residential use of power. This makes Wyoming the most productive industrial state in the USA. The second, interestingly enough, is Kentucky! Notice that the two states with the lowest power rates are also the most productive industrial states in the nation.
1. Wyoming
2. Kentucky
3. Indiana
4. Iowa
5. Idaho
6. Alabama
7. South Carolina
8. Arkansas
51. DC
50. Florida
49. New York
48. New Jersey
47. Massachusetts
46. Rhode Island
45. Connecticut
44. Arizona
On top though are Kentucky and Wyoming with the highest industry to consumer power use ratios. If you are thinking about moving your plant someplace look at these two states first for their affordable power and favorable business climates. South Carolina looks good except that they have a personal income tax making labor cost more.
In Last place, DC! they produce nothing, have no industry, and high power and tax rates. You can't get a job in DC because there is no industry to support a job.
In first place;
Go Wyoming! Lots of industry, no corporate or personal income tax, and affordable power.
In second place it’s Kentucky, Indiana, Iowa, Idaho, Alabama, or South Carolina depending on other factors you look for such as climate, open space, or labor force.
2. Government consumes without actually producing anything.
3. Looking for job? Consider Wyoming which has more industry than people!
I found a spread sheet that details power costs and consumption between residential, industrial, and commercial customers. I’ve discovered some stunning relations and trends in electric power consumption.
Anomalies
First the anomalies in power consumption;1. DC; The District of Columbia, has the lowest industrial to residential power use of ANY state. The amount of non-productive power use in DC is stunning. The average ratio for all states in 2004 is 0.83, DC has an astonishingly low ratio of 0.03. Nothing of commercial value is produced in DC at all.
2. Kentucky has THE LOWEST power prices of ANY state. 4.60 cents per kwh. That’s lower than number 2 Wyoming at 4.96. Washington State comes in 5th on the list of cheap power states at 5.56. Kentucky gets it’s inexpensive power because they 1) Fight for it and keep thieves and scoundrels from looting their power system – court fights to keep the power inexpensive. 2) They have billions of tons of coal and they use it freely to produce power.
Note the most expensive power in the country is in Hawaii at 16 cents per kwh.
3. Wyoming has THE highest ratio of industrial to residential use of power. This makes Wyoming the most productive industrial state in the USA. The second, interestingly enough, is Kentucky! Notice that the two states with the lowest power rates are also the most productive industrial states in the nation.
Highest Production Ratio
In order the most productive States in the USA are;1. Wyoming
2. Kentucky
3. Indiana
4. Iowa
5. Idaho
6. Alabama
7. South Carolina
8. Arkansas
Lowest Production Ratio
In order the least productive States in the USA are;51. DC
50. Florida
49. New York
48. New Jersey
47. Massachusetts
46. Rhode Island
45. Connecticut
44. Arizona
Most Power Burned
Texas, California, and Florida burned the most electricity total with Texas, Ohio, and California burning the most power for industrial purposes. Of these three California is least efficient at converting electricity to wealth and Ohio is the most efficient.On top though are Kentucky and Wyoming with the highest industry to consumer power use ratios. If you are thinking about moving your plant someplace look at these two states first for their affordable power and favorable business climates. South Carolina looks good except that they have a personal income tax making labor cost more.
Summary
The final score is;In Last place, DC! they produce nothing, have no industry, and high power and tax rates. You can't get a job in DC because there is no industry to support a job.
In first place;
Go Wyoming! Lots of industry, no corporate or personal income tax, and affordable power.
In second place it’s Kentucky, Indiana, Iowa, Idaho, Alabama, or South Carolina depending on other factors you look for such as climate, open space, or labor force.
Lessons Learned
1. Inexpensive Power is the Key to prosperity.2. Government consumes without actually producing anything.
3. Looking for job? Consider Wyoming which has more industry than people!
Subscribe to:
Posts (Atom)